


The SAMSI-FODAVA Workshop on Interactive Visualization and Analysis of Massive Data will be held on December 10-12, 2012.
Latest News and Events
The FODAVA Annual Meeting will immediately follow (Dec 12-13) the SAMSI/FODAVA joint workshop at the same location.
Posted: September 05, 2012
Many of the modern data sets such as text and image data can be represented in high-dimensional vector spaces and have benefited from computational methods that utilize advanced techniques from num
Posted: June 30, 2012
Other Data and Visual Analytics News
BIGDATA and Cloud-based Analytics Data is multiplying at a faster rate than we have ever seen. It's not just for businesses anymore, but individual's now utilize the power of data analytics to better enhance many areas of their own lives. Back in May 2012, Google opened up public access to their BigQuery data analytics service, seeing the public demand to enhance their business' needs. In the research community, Hadoop has been used in many pursuits to create environments that can not only work with massive amounts of data, but also do the heavy lifting. Cloud services have continued to see a rise in the tech community, and eventually it will become mainstream. It's only a matter of time. Now with both the momentum in BIGDATA and the Cloud, there's no doubt, there will be an onslaught of new services that deal with analytics. Analytics have heavily relied on industry professionals. Now with cloud technology in so many fields, running your own analytics without prior knowledge of these complex systems will become a reality. |
2012 Presidential Election Visualizations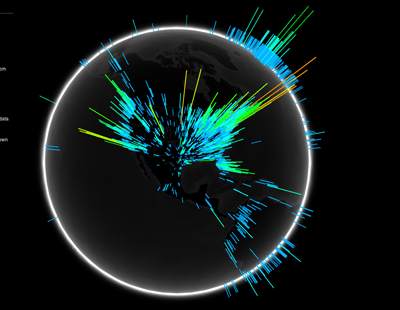 The Presidential election day in 2012 was full of emotion on Twitter, following an intense set of exchanges from both parties in the concluding month. Once again, similar to the Sandy visualizations we posted a few days ago, many visualization enthusiasts released their visualization onto their websites. Below is a list of some interesting visualizations performed. Visualizing.org - Here is a 3D visualization of the globe with data points on where the tweets came from and their content, whether it was directed about one of the candidates and whether it was a positive or negative comment. It allows you to spin the globe around to see around the world to get a picture of the social reactions posted. The Guardian's Map - An interactive map that allows you to dig down into the county specific results. For those that are interested in having this data to do some of your own visualizations, download it here (also contains other visualizations. Scoop.it Map Morphs - Ever wonder what the US map would look like if each state were morphed to a size that reflected the amount of money spent or the number of electoral votes? This site shows a very fun and interesting view on exactly that. CNN's Facebook Insights - This one allows you to view Facebook post statistics which can be filtered by age, gender, time and location. Do what you can with it since the visualizations across the different criteria groupings look too much alike, since the line graph contains a huge spike on election day. |
Superstorm Sandy social visualizations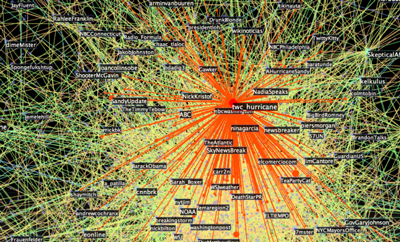 Visual-Analytics.org took to the twitter data feeds and plotted the interactions of users tweeting about Superstorm Sandy (#sandy) that hit the northeast side of America recently. Every dot in their visualization represents users on Twitter, while the connections between the dots are the retweets of the original Sandy-related posts. Head on over to their post and see if you can find some interesting patterns. The visualization software used for the visualizations was Graph Insight. |
$34 Billion forecasted for Smart Grid Data Analytics Smart grids are electrical grids which use information and technology to supply electricity through more efficient means throughout their grid. Forecasters have predicted that Smart Grids will spend $34 Billion over the next 8 years, up to 2020. Smart grids produce massive amounts of data at a very high rate, and the volume of data being output by Smart Grids are forecasted to grow by magnitudes over time. More for reading, visit Daily Finances article. |
Bringing data analytics to the social workforce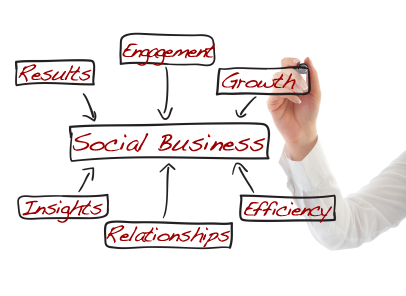 The latest installment of IBM's Connections software adds BIG DATA analytics to their social connection software. Having real-time analytics on massive data sets is one of the driving forces in the analytics scene where speed and precision allow for better and quicker decision making. In this social age, even businesses are shifting towards being a more viable social business - a business that bridges the social interactions of potential customers and it's product's brand, marketing and direction. With so much data being produced at the web and mobile level, it's natural to see so many solutions gravitate towards using every bit of information which can give them an edge. |
Visual Analytics Library for learning and teaching The Visual Analytics Digital Library is a great structured web resource for visual analytics. The motivation behind the site is to organize and consolidate useful materials to encourage education and research within the visual analytics field. In addition to providing some of the latest research materials happening in visual analytics, the digital library provides even the most basic materials for those interested in learning more about visual analytics. The VADL (Visual Analytics Digital Library) includes a collection of videos, recorded lectures supplemented with Powerpoint presentations, sample tests and other documents organized into their prototype taxonomy. A quick overview of the general menu shows the following
|
Wolfram Alpha offers personal Facebook analyticsWolfram Alpha just announced a new feature that performs data analytics on your Facebook data. “Wolfram|Alpha knows about all kinds of knowledge domains; now it can know about you, and apply its powers of analysis to give you all sorts of personal analytics.” If you feel the need to know more about yourself and your posting habits, go check it out. They should be adding more features as months go by, depending on how their users use the feature. |
US Open Tennis and BIG DATA Analytics Predictive analysis and social media analysis results are going to be at the fingertips of tennis fans worldwide when the US Open rolls around this year. By tracking real-time data alongside historical data, IBM will be feeding tennis fans with more data and more predictions than ever before by delivering the massive amounts of statistical data through the Web and their new iPad app. |
BIG DATA firm AbsolutData gets $20 million investment BIG DATA has been on the rise lately, receiving action from the government earlier this year and a multitude of investments from investment firms. It's no surprise that BIG DATA has turned as many eyes as it has recently. Read more about the $20 million investment by Fidelity Growth Partners India, the private equity arm of Fidelity. |
Machine Learning on Social Media Data - Livehoods.org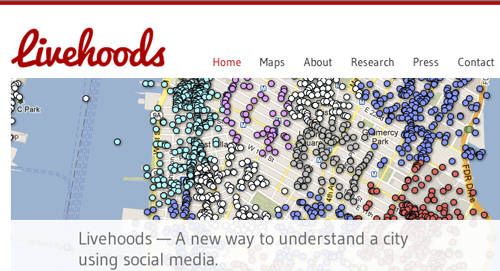 Livehoods.org is very interesting site that combines social media data along with data/visual analytics. It's no surprise that this data can have extremely meaningful information, especially in an age where social media is now such an integral part of our society. Go check out their use of machine learning algorithms to analyze the massive amount of location-aware check-in data. According to their website - "Livehoods offer a new way to conceptualize the dynamics, structure, and character of a city by analyzing the social media its residents generate. By looking at people's checkin patterns at places across the city, we create a mapping of the different dynamic areas that comprise it. Each Livehood tells a different story of the people and places that shape it." |